When it comes to supporting students with disabilities, knowing how IQ scores work can be a helpful part of the process. IQ, or Intelligence Quotient, is often used to help determine a child’s cognitive abilities. For special education teachers and IEP teams, understanding IQ ranges and how they connect to evaluations and eligibility for services is an important piece of the puzzle.
Whether you’re new to IEP writing or a seasoned special educator, learning about IQ ranges can help you better understand what the scores mean, how they are tested, and what steps to take if you suspect a student has a low IQ. Together, let’s walk through how IQ is measured, what the different ranges are, and how to use that information to advocate for appropriate supports.
What Is IQ and Why It Matters in Special Education
IQ stands for Intelligence Quotient. It’s a score that helps show how a child’s thinking and learning skills compare to other children the same age. IQ is not a full picture of a child’s abilities, but it’s one important piece used when deciding if a student may need special education services (and helpful data to include in a child’s Present Levels).
IQ scores can help the IEP team better understand a student’s strengths and areas of need. They can also be used to help identify students with intellectual disabilities or giftedness, depending on the score and other data.
How is IQ Measured?
IQ is measured through standardized cognitive assessments. These are given by a school psychologist or another qualified professional during a full educational evaluation. The tests must be approved and scientifically valid.
Commonly used IQ tests in schools include:
- WISC-V (Wechsler Intelligence Scale for Children)
- Stanford-Binet Intelligence Scales
- DAS-II (Differential Ability Scales)
- KABC-II (Kaufman Assessment Battery for Children)
These tests include questions that measure things like memory, language, reasoning, and visual-spatial skills. The results are used to find the Full Scale IQ (FSIQ), along with other sub-scores that break down different types of thinking.
What are the Standard IQ Ranges?
IQ scores are based on a scale where 100 is considered average. Most people fall between 85 and 115. Here are the typical IQ score ranges used in schools:
- 130 and above: Very superior
- 120–129: Superior
- 110–119: High average
- 90–109: Average
- 80–89: Low average
- 70–79: Borderline
- Below 70: Extremely low (which may indicate an intellectual disability)
It’s important to remember that an IQ score is just one part of the evaluation and is only one data point. No decisions should be made based on IQ alone. The full picture, and whole picture, of a child needs to include academic skills, adaptive behavior, classroom observations, and input from the IEP team.
Understanding the Bell Curve and IQ Distribution
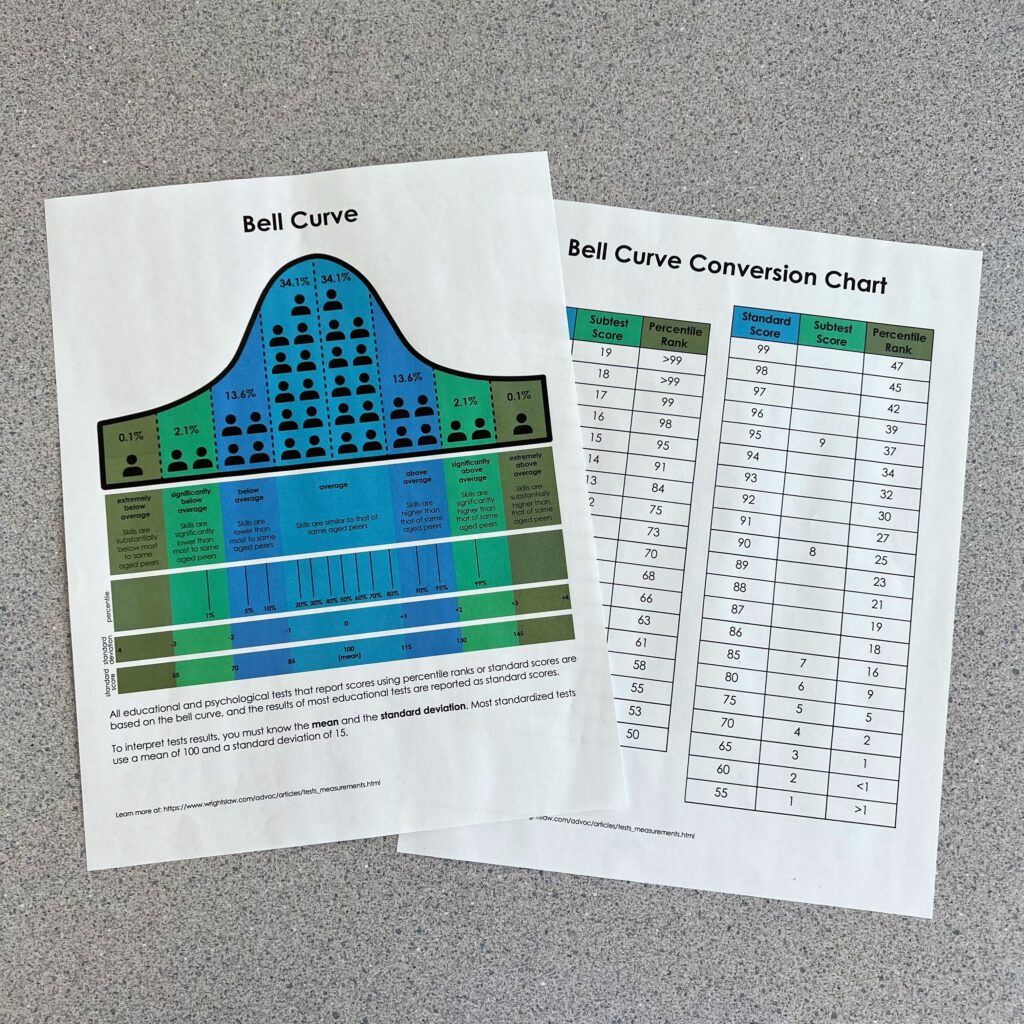
When you hear about IQ scores, they’re almost always discussed in terms of a bell curve. A bell curve is a graph that shows how scores are spread out across a population. Picture a hill or a rainbow shape: wide at the bottom, highest in the middle, and sloping down on both sides. This shape shows that most people score near the average, and fewer people score very high or very low.
On the bell curve for IQ:
- The middle of the curve is 100, which is the average IQ score.
- Scores between 85 and 115 fall within one standard deviation of the average. This range includes about 68% of the population.
- As you move further from the center, the number of people with those scores gets smaller.
- Scores below 70 (on the far left) or above 130 (on the far right) are much less common and can indicate a need for additional services or gifted programming.
You can also think of the bell curve like a classroom seating chart. Most students are sitting near the center of the room. Only a few are in the front row (very high scores), and a few are in the back row (very low scores). This helps us see where a student’s score falls in comparison to others, and how much support they might need.
What to Do if You Think a Student Has a Low IQ
If a student is showing signs of struggling in many areas, like language, memory, attention, or problem-solving, it may be time to gather more data. Teachers should start by documenting classroom performance, collecting data through interventions, and talking with families. This might include using RTI or MTSS to support the student and monitor progress.
If the student continues to struggle even with support, a referral for a full evaluation might be needed. This would include cognitive testing and academic assessments to see if the student qualifies for special education supports and services.
As a teacher, your observations and classroom data are essential. You don’t need to diagnose or guess a student’s IQ (and you shouldn’t), but what you can do is help the team understand what’s happening day to day. Sharing concerns early can lead to faster support and better outcomes for students.

IQ is just one tool in the special education toolbox. Knowing how to read IQ scores, and where they fall on the bell curve, can help teachers and IEP teams understand a student’s unique learning profile. But what’s just as important is what we do with that information. Data should guide decisions and all discussions about a child’s education should be data driven; data should not limit expectations.
Every student brings something special to the classroom and to your caseload, no matter where they land on the chart. With the right support and a strong IEP team behind them, students with low IQs can make meaningful progress and reach goals that matter.

Writing IEPs doesn’t have to be overwhelming! The Intentional IEP gives you the tools, training, and resources to turn IEP chaos into clarity. With access to 10,000+ data-backed, standards-aligned goals, expert-led trainings, and ready-to-use data collection tools, you’ll save time, reduce stress, and feel confident in every IEP you write. Join today and transform your IEP process!