If you’ve ever told yourself, “I’ll remember that data point and write it down later,” and then three days (and 400 tasks) went by… you are absolutely not alone.
Special education teachers are constantly juggling instruction, behavior, communication with families, IEP meetings, paperwork, and a million small decisions in between. Data collection is critical—but when it lives in its own separate box, it can quickly feel like a dreaded extra task instead of a natural part of teaching.
The good news? It doesn’t have to be that way.
You can integrate data collection into the lessons and routines you’re already doing so that it becomes second nature, rather than “one more thing on your plate.”
Let’s walk through how.
Why Data Shouldn’t Happen in Isolation
One of the biggest mindset shifts is this: Data collection should not happen in isolation.
If a student can only demonstrate a skill one-on-one with you at a small group table, they haven’t truly mastered it yet. Mastery means the student can generalize the skill—use it with different materials, in different settings, and with different people.
When we only collect data in one very specific situation, we don’t get the full picture. We need data that reflects:
- Different environments
- Different partners or staff members
- Different types of tasks or materials
That full picture is what helps us confidently say, “Yes, this student is really making progress on this IEP goal.”
The Big Non-Negotiable: Know Your IEP Goals
Here’s the hard truth: You cannot collect meaningful data if you are fuzzy on what the IEP goals actually say.
Everything starts here.
If you don’t have the goal front and center, it’s easy to collect “interesting” data that isn’t actually aligned with what you’re responsible for monitoring.
Some ways to keep goals at your fingertips:
- IEP Snapshots: A one-page summary with the student’s goals, services, accommodations, and key information.
- Goal-at-a-Glance Sheets: A list of goals organized by area (reading, math, behavior, communication, etc.) that you can keep with your lesson plans.
- Grouped Goal Lists: Group students by similar skills so you know which students you can target in the same activity.
- Digital Spreadsheet or Checklist: Some teachers love using Google Sheets or Excel to track who is working on what.
Whether you memorize, write them out, color-code, or put them on sticky notes, the point is the same: When you know the goals well, you start seeing natural opportunities for data everywhere.
Data Collection Methods You Can Actually Use
You do not need a complicated system to collect good data. Start with what fits your teaching style and your reality.
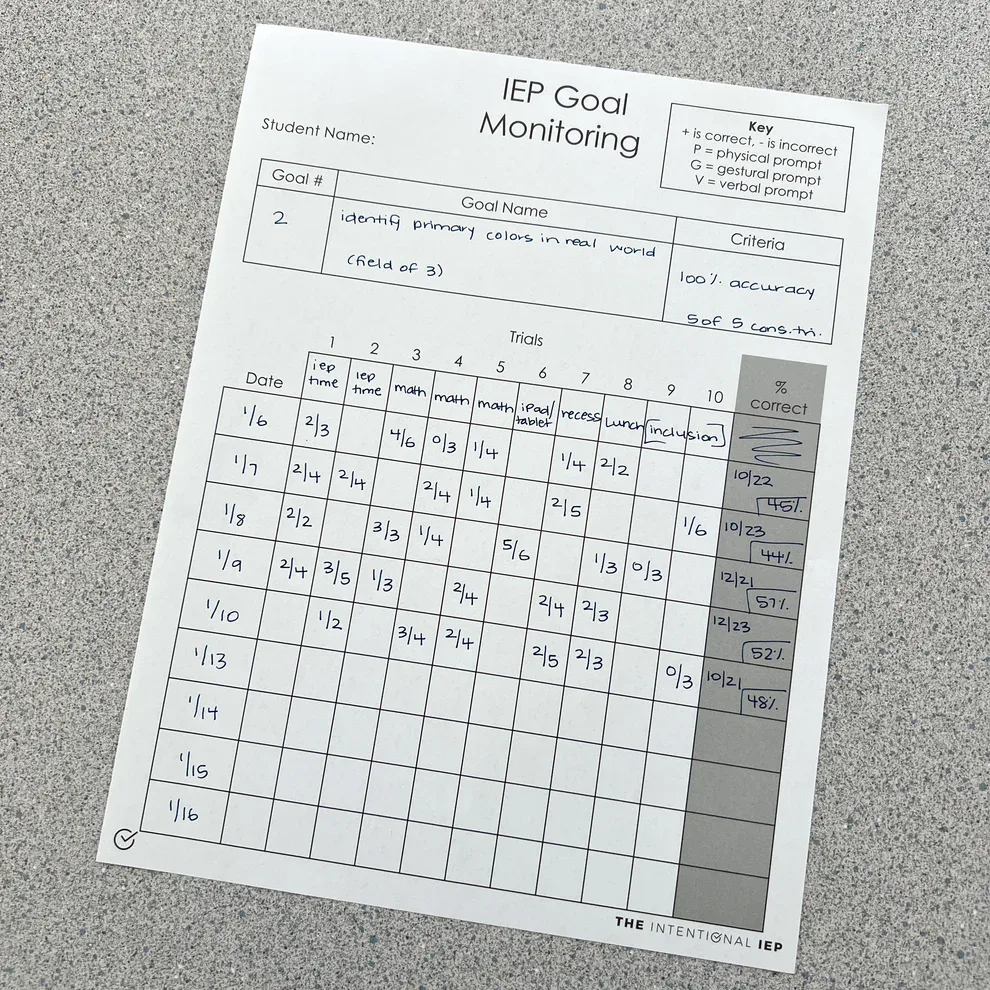
1. Paper–Pencil Method
For many teachers, this is the classic and most comfortable option.
- Printed data sheets
- A clipboard
- A timer (if needed)
- Your favorite pen or pencil
You can keep goal-specific data sheets handy for individuals or groups and mark as you go during a lesson.
2. The Sticky Note Method
Sticky notes are a flexible and surprisingly powerful way to collect data in the moment.
A simple structure makes them even more effective:
- Top left: Activity name (short code or title of the task)
- Top right: Date—boxed in so it doesn’t get mixed up with scores
- Middle: Student initials in the left column, with columns for correct/incorrect, tallies, or plus/minus marks
- Bottom: Total correct out of total trials (e.g., 7/11)
You can:
- Track multiple students on one sticky note
- Use tallies or +/– marks
- Quickly transfer scores to a formal data sheet or digital form later
This method shines when you’re mid-lesson and need a quick way to capture what’s happening without stopping instruction.
3. Digital Data Collection
Digital tools are fantastic if you like having graphs and spreadsheets generated for you.
Many teachers use:
- Google Forms
- Apps or web-based data platforms
- Tablets, laptops, or phones to log in-the-moment data
One efficient system is to:
- Create a folder for each student
- Store Google Forms aligned to their specific IEP goals
- Input data directly during or right after a lesson
Digital forms make it much easier to sort, filter, and analyze data later.
4. Hybrid Method
You don’t have to choose just one.
A hybrid method might look like:
- Collecting quick data on sticky notes or paper during instruction
- Entering those numbers into a Google Form at the end of the day or week
- Letting the spreadsheet and graphs update automatically
This gives you the flexibility of paper with the power of digital analysis.
Understanding Different Types of Data
Knowing how to take data is one piece; knowing what kind of data you’re collecting is just as important. Different types of data answer different questions.
Here are some key pairs:
- Qualitative vs. Quantitative
- Qualitative: Tells the story—anecdotal notes, observations, descriptions of how a student approached a task.
- Quantitative: Gives the numbers—percent correct, frequency counts, duration of a behavior, test scores.
- Direct vs. Indirect
- Direct: You observe the student performing the skill (work samples, quizzes, live observation).
- Indirect: Someone reports on the student’s performance (rating scales, surveys, interviews, questionnaires).
- Formative vs. Summative
- Formative: Ongoing checks during instruction—exit tickets, running records, quick probes. Helps you adjust teaching.
- Summative: End-of-period or end-of-unit data—final tests, post-assessments, end-of-year measures.
- Formal vs. Informal
- Formal: Standardized tests, norm-referenced assessments, formal evaluations.
- Informal: Classroom quizzes, teacher-created tasks, homework, observational notes.
- Product vs. Process
- Product: The final work—worksheet, written response, completed project.
- Process: How the student got there—strategies used, level of prompts needed, observable behavior during the task.
- Baseline vs. Progress Monitoring
- Baseline: Where the student started before instruction—used to set reasonable, measurable goals.
- Progress Monitoring: Ongoing data collected throughout the year to see if the student is moving toward the goal.
No single type of data can tell the whole story. A strong IEP has multiple data points from multiple types of data so that the team can confidently answer: “Is the student learning and progressing, and how can we best support them?”
Real-World Examples: Embedding Data Into Everyday Lessons
Once you know your goals and your tools, the magic happens in real lessons. Here are a few ways to integrate data collection into things you’re already doing:
Phonics Readers and Picture Books
Using a simple phonics mini reader, you might:
- Track one student’s decoding accuracy and fluency
- Ask another student in the same group to identify colors, shapes, or objects in the pictures
- Talk about how a character feels to target emotional vocabulary and inferencing
- Ask where something is (under the rug, on the table) to hit prepositions
One book. Multiple goals. Multiple data points.

Magnetic Letters
With a tub of magnetic letters, you can:
- Have students build sight words or CVC words
- Count how many letters are in each word (one-to-one counting)
- Count vowels vs. consonants (sorting and categorizing)
- Clap and count syllables in the words
- Compare which stack of letters is taller or which word has more letters (basic math comparison)
Again, you’re teaching one activity but touching many goals—and you can easily track correct/incorrect responses, independence, or prompts needed.
Adapted Readers and Sentence Building
With adapted books and movable pieces, you might:
- Ask one student to match pictures (identical or non-identical)
- Have another student build or arrange the sentence strips to match the picture
- Ask a third student to write the sentence on paper
You can collect data on fine motor skills, reading, writing, matching, and comprehension—all while using the same core material.
Walking Down the Hallway
Even simple routines can become data-rich:
- Counting steps
- Touching heel-to-toe to work on balance and gross motor
- Looking for specific items (colors, shapes, environmental print)
- Practicing turn-taking and following directions
When you’re clear on your goals, you start seeing opportunities for data everywhere.
Bringing It All Together: Your Next Step
The heart of all of this is simple:
- Know your students’ IEP goals well.
- Choose data collection methods that fit your style.
- Intentionally design lessons so data collection is built in, not bolted on.
Here’s a practical challenge to get started:
- Choose one student.
- Review one IEP goal.
- Plan one lesson where you intentionally embed data collection for that goal.
- Take data as you teach—using sticky notes, a paper form, a digital tool, or a hybrid.
Once that feels manageable, add another student, another goal, another lesson. Over time, looking for data collection opportunities will become second nature.
IEP paperwork can feel overwhelming, but it is ultimately your roadmap for what to teach and what to track. When you follow that map and weave data into your daily lessons, progress monitoring stops being a scramble and becomes part of the rhythm of your classroom.
And that’s when data collection shifts from “one more thing” to a powerful, natural part of the way you teach.

Writing effective IEPs is so much easier when you have the right tools in your toolbox! Inside The Intentional IEP, you’ll get access to expert-led trainings, a searchable IEP goal bank with IEP Screeners, and ready-to-use resources that take the guesswork out of IEP writing and implementation. With the right tools at your fingertips, you’ll save time, reduce stress, and feel confident in creating IEPs that truly support your students. Join today and fill your IEP toolbox with everything you need!